
How big are Sri Lanka's non-tourism Services Exports?
An attempt to get the rest out of tourism's shadow

Finally delivering on some of the promises of higher frequency and richer data on external sector transactions, CBSL started reporting monthly services sector export and import data for the first time for January 2024 onwards. This is on the back of the implementation of the International Transactions Reporting System (ITRS) that was kickstarted back in 2022. It was initiated as a measure to help better understand the FX transactions happening during the height of the crisis. Hopefully this leads to monthly current account balance data sooner than later.

The monthly data does increase the categories of services sector data reported, allowing for a better understanding. Unfortunately the new monthly data does not improve on the existing monthly tourism earnings data, which continues to be estimate based on a survey done at the airport. As my colleagues at Frontier Research pointed out in a recent report, using other proxies, the actual tourist earnings can be around 20% below the estimated figure. Given the tourism recovery is obvious, I will be focusing more on the other service exports in this article. (Note that in the data travel refers to direct tourism related transactions.)
The new monthly data
Currently we only have monthly data for Jan 2023 and Jan 2024. On the tourism/travel side the data shows about $15mn/month in travel related outflows. Excluding travel, services exports appear to be about $250mn/month. But Jan 2024 seems to have more service imports, reducing net exports when tourism is excluded.
Within the services exports excluding tourism, the sectors of sea transport (related to port services), air transport (related to airport & air travel services) and Telecom/IT services (including BPO) are the three largest export sectors accounting for 75-80% of exports. Of the other smaller sectors, construction and other business services are the largest, both of which have increased in size since the 2021-2022 crisis.
Table: Services sector data breakdown for Jan 2023 & Jan 2024, $ million

There are also sectors in this data that were not covered in the quarterly BOP data previously, especially manufacturing services, so the two datasets are not directly comparable. But for those sectors that are covered in both, it is possible to get an idea of the avg monthly trend in recent years.
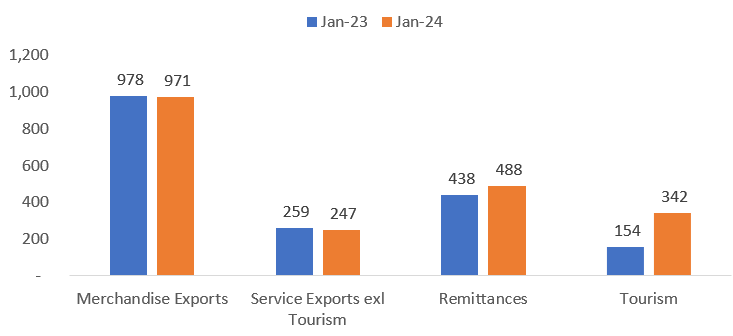
In terms of FX earnings outside of merchandise exports, on a monthly basis services exports (excl tourism) remain small. And the growth in both services exports excl tourism and merchandise exports has been stagnant. As a result, Sri Lanka remains highly dependent on tourism and remittances growth to boost FX earnings in the near term.
Figure: Major types of Monthly FX earnings, $ million
Services exports over time
The quarterly BOP data from the past can be used to see what average monthly services exports were like each quarter till 3Q-2023. Overall, it shows that during 2018-2019, monthly services exports (excl tourism) were about $300-350mn. But this dropped to around $150mn during the pandemic and economic crisis (2020-2022), particularly due to lower earnings from air transport related services as air travel dropped and lower shipping as well. Increased Telecom/IT services helped somewhat. From 2023 the exports have recovered to around $200-250mn per month.
Note that it is possible that with the introduction of the new data collection and categories, some of the older categories have been restructured, with the older quarterly data not directly comparable. But the analysis here is to get an idea of the changes and growth overtime, rather than provide exact numbers.
Figure: Avg monthly Services (excl tourism) exports, $ million

But the picture with regards to net service exports (exl tourism) is a bit different, due to the imports attached to services sectors. Net exports were only around $100mn a month prior to the crises, dropped to ~$50mn during the pandemic and then recovered to over $100mn since 2021.
Figure: Avg monthly Services (excl tourism) net exports, $ million

The imports related to these services sectors (exl tourism) have reduced significantly over this period, reducing from around $200-250mn per month pre-crisis. Even now its only recovered to around $100-150mn.
Figure: Avg monthly Services (excl tourism) imports, $ million

Changes in the makeup of Net Service Exports
An interesting tidbit within the ‘Other’ service exports category above is the increase in exports related to construction services and other business services, albeit at small numbers. Meanwhile exports of financial services and insurance & pension related services have reduced.
Figure: ‘Other’ smaller services export sectors, $ million

The increase in construction related service exports is interesting since it’s been one of the most affected sectors due to the crisis. Anecdotally, there have been indications the sector has been looking to get foreign projects. It’s managed to become a non-insignificant net exporter in the process, driven mostly by “Architectural, engineering & other technical services” going by the monthly figures for Jan 2024.
Figure: ‘Other’ smaller services net exports, $ million

But there has also been an expansion in net imports from the Other Business services sector. Given the breakdowns given for January, it might be an impact of some firms moving certain operations to places like Singapore and Dubai during 2022-2023.
Table: Breakdown of Construction & Other business services for Jan 2023 & Jan 2024, $ million

Services exports critical to external balance
Net services exports (excl tourism) plays a significant role in the current account surplus that Sri Lanka has been maintaining since 3Q-2022.
Figure: Current account surpluses & Net Service Exports, $ million

Tourism and remittances are of course much larger in their contribution to the overall external balances, but expanding other services exports allows diversification and reduce the impact of shocks concentrated in the tourism and remittance earnings.
The analysis is based on data that is currently available and would likely change as its updated and revised by CBSL. This is my analysis and opinions, but forms part of my macro work at Frontier Research.